.svg)

Plus: How BI could be the key to saving hundreds of thousands of dollars.
Originally published on: November 19, 2015
Data on its own can’t solve your business challenges.
The fact is – no matter what software solution you’re using, you should have data at your fingertips. Where a lot of companies get tripped up is being able to read, understand and interpret data in a meaningful way.
Nobody wants to sift through 365 pages of data to find the one thing they’re looking for. You want the important stuff – and you want it to tell you a story. That way, you can decide on clear next steps and action items that can help you:
- Solve a problem
- Focus on highest value opportunities
- Futureproof your business
Here are three business intelligence best practices for digging deeper into your data:
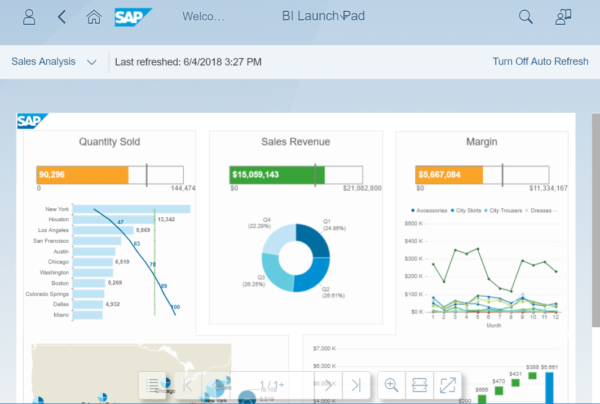
Visualize data with interactive displays.
Everyone absorbs information differently. So, you should be able to access (and share) data from your data warehouse in ways that tell a story to the intended audience, leaving no room for misguided interpretations or second guessing. For some, this means visualization.
Visualization makes information easier to comprehend at a glance, so decision-makers can find the information they need faster. Within BI, you should be able to customize reports to display in various formats (simple data grids, charts, cross tab layouts, or other formats).
Where BI tools can go the extra mile is through interactive visualization. By simply changing parameters on your data model, you can create “what-if” scenarios, compare data within different timeframes, and ideate in real-time.
Customize reports for your business needs.
With Business Intelligence tools, you’re not limited to the standard reports that come with your system. You can target precise information and create reports that meet your specific needs.
This concept sounds simple – but customizable reports can translate into a reduction in manual work for your team members, and money saved (especially when factoring in audits).
Take this example of a company that used TEAM’s BI tool to create a custom report which resulted in a savings of $250,000 in 24 hours.
Once the ‘who’ and the ‘what’ is determined to help guide the report, custom reporting allows you to build the roadmap that will help you answer those questions quickly and easily in the future.
Access reports when and where you need them.
Having information from across your organization is just one part of the equation. Having access to it where and when you need it is equally important. Many BI tools offer flexible accessibility. For example, you can access reports online or through a mobile app, or receive scheduled, automated reports via email.
Pro tip: think about automation as a method of communicating with your workforce consistently and regularly. For example, by using a General Ledger universe within TEAM’s BI tool, you can drag-and-drop reporting information for your finance team and schedule it to send updated reports at a cadence of your choosing. The same can be said for scheduling details for your ops team or generating action items for managers.
Format your data warehouse to create your own reports in a layout that makes the most sense for you. Users can run previously created reports or create custom reports.
With interactive, customizable BI tools available anywhere, anytime, users can find the meaningful information they need to make smart business decisions.
Want to learn more about BI and business intelligence best practices? See how our business intelligence and analytics solutions tackle hard data for better results.


.jpg)